WeeWX#
About#
WeeWX is a free, open source weather station data collection software written in Python. It supports many popular weather stations.
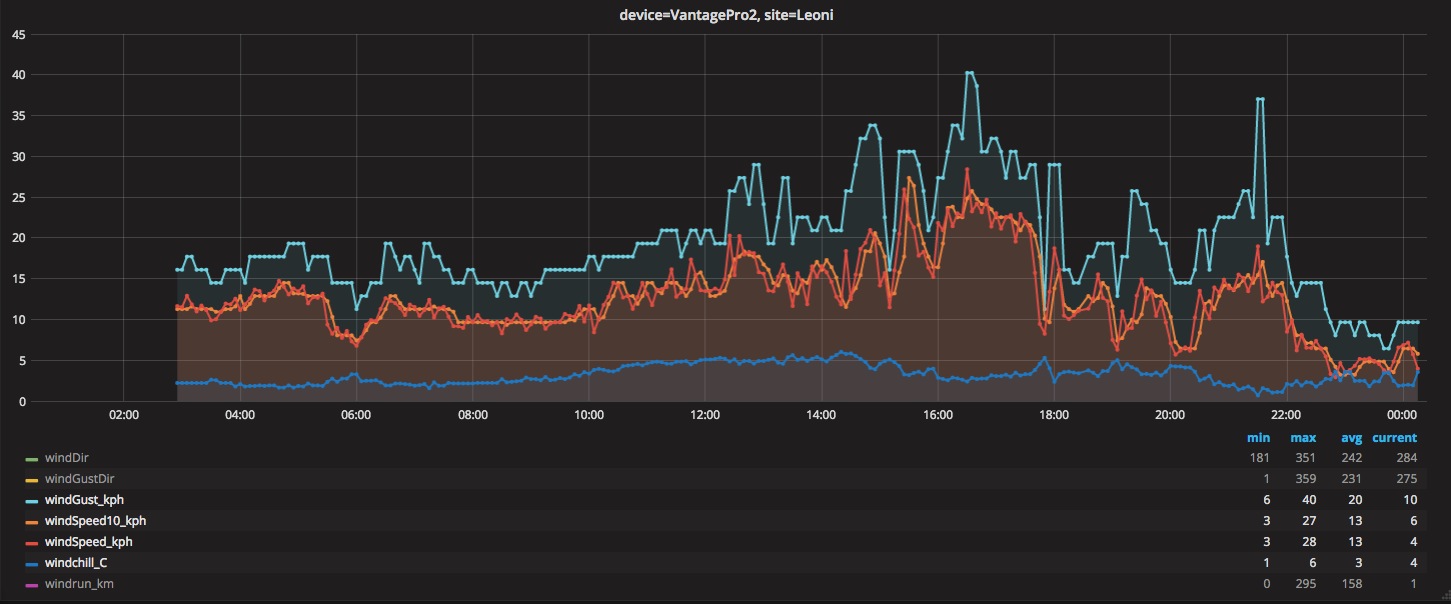
To store all data in InfluxDB and display it in Grafana, we connected a Davis Vantage Pro2 weather station, added the MQTT Plugin for WeeWX into the mix - and voilà …
Live data: https://swarm.hiveeyes.org/grafana/dashboard/db/weather-leoni
Embedded view:
Environment#
Let’s have a look at the environment:
WeeWX is a popular program able to read data from a variety of weather stations.
MQTT is a machine-to-machine (M2M)/”Internet of Things” connectivity protocol.
Telemetry data is transmitted from WeeWX to the MQTT broker using the MQTT Plugin for WeeWX. An example JSON payload published from this plugin to the MQTT bus is:
weewx/097287c4-6fb0-4aeb-a095-00d65ecb15f7/Leoni/VantagePro2/loop
{
    "windSpeed10_kph": "5.78725803977",
    "monthET": "1.32",
    "highUV": "0.0",
    "cloudbase_meter": "773.082217509",
    "leafTemp1_C": "8.33333333333",
    "rainAlarm": "0.0",
    "pressure_mbar": "948.046280104",
    "rain_cm": "0.0",
    "highRadiation": "0.0",
    "interval_minute": "5.0",
    "barometer_mbar": "1018.35464712",
    "yearRain_cm": "17.2000000043",
    "consBatteryVoltage_volt": "4.72",
    "dewpoint_C": "2.07088485785",
    "insideAlarm": "0.0",
    "inHumidity": "29.0",
    "soilLeafAlarm4": "0.0",
    "sunrise": "1492489200.0",
    "windGust_kph": "9.65608800006",
    "heatindex_C": "3.55555555556",
    "dayRain_cm": "0.0",
    "lowOutTemp": "38.3",
    "outsideAlarm1": "0.0",
    "forecastIcon": "8.0",
    "outsideAlarm2": "0.0",
    "windSpeed_kph": "3.95409343049",
    "forecastRule": "40.0",
    "windrun_km": "1.07449640224",
    "outHumidity": "90.0",
    "stormStart": "1492207200.0",
    "inDewpoint": "45.1231125123",
    "altimeter_mbar": "1016.62778614",
    "windchill_C": "3.55555555556",
    "appTemp_C": "1.26842313302",
    "outTemp_C": "3.55555555556",
    "windGustDir": "275.0",
    "extraAlarm1": "0.0",
    "extraAlarm2": "0.0",
    "extraAlarm3": "0.0",
    "extraAlarm4": "0.0",
    "extraAlarm5": "0.0",
    "extraAlarm6": "0.0",
    "extraAlarm7": "0.0",
    "extraAlarm8": "0.0",
    "humidex_C": "3.55555555556",
    "rain24_cm": "0.88000000022",
    "rxCheckPercent": "87.9791666667",
    "hourRain_cm": "0.0",
    "inTemp_C": "26.8333333333",
    "watertemp": "8.33333333333",
    "trendIcon": "59.7350993377",
    "soilLeafAlarm2": "0.0",
    "soilLeafAlarm3": "0.0",
    "usUnits": "16.0",
    "soilLeafAlarm1": "0.0",
    "leafWet4": "0.0",
    "txBatteryStatus": "0.0",
    "yearET": "4.88",
    "monthRain_cm": "2.94000000074",
    "UV": "0.0",
    "rainRate_cm_per_hour": "0.0",
    "dayET": "0.0",
    "dateTime": "1492467300.0",
    "windDir": "283.55437192",
    "stormRain_cm": "1.72000000043",
    "ET_cm": "0.0",
    "sunset": "1492538940.0",
    "highOutTemp": "38.4",
    "radiation_Wpm2": "0.0"
}
System overview#
// weeWX -> Grafana system overview digraph weewx { // Options rankdir=LR; ranksep=0.5; // Style //graph [splines=ortho]; node [pin=true, shape="box", fontname="Verdana"]; edge [fontname="Verdana"]; // Graph nodes represent system components "weather-station" [label="Weather station"]; "weewx" [label="weeWX"]; "weewx-mqtt-plugin" [label="weeWX MQTT plugin"]; "mqtt" [label="MQTT"]; "kotori" [label="Kotori"]; {rank=same; "influxdb"; "grafana" }; "influxdb" [label="InfluxDB"]; "grafana" [label="Grafana"]; // Graph edges represent communication paths "weather-station" -> "weewx"; "weewx" -> "weewx-mqtt-plugin"; "weewx-mqtt-plugin" -> "mqtt" [label="JSON"]; "mqtt" -> "kotori"; "kotori" -> "influxdb"; "kotori" -> "grafana"; "influxdb" -> "grafana"; }Receive weather information from digital weather stations using WeeWX.
Publish them to the MQTT bus using the MQTT Plugin for WeeWX.
Store measurements to the InfluxDB timeseries database.
Automatically create Grafana panels for instant telemetry data visualization.
Live weather data with Grafana#
Setup#
This section is about running the whole platform on your own hardware. For full installation of the InfluxDB/Grafana/Mosquitto/Kotori stack, please have a look at the Setup page.
WeeWX#
For setting up WeeWX, see also http://www.weewx.com/docs.html.
Setup WeeWX MQTT plugin#
Install the MQTT python bindings:
sudo pip install paho-mqtt
Download and install the plugin:
wget http://lancet.mit.edu/mwall/projects/weather/releases/weewx-mqtt-0.15.tgz
wee_extension --install weewx-mqtt.tgz
Configure plugin in weewx.conf:
[StdRestful]
    [[MQTT]]
        server_url = mqtt://username:password@mqtt.example.org:1883/
        topic = weewx/097287c4-6fb0-4aeb-a095-00d65ecb15f7/Leoni/VantagePro2
        unit_system = METRIC
Kotori#
Activate weewx.ini as configuration:
ln -sr /etc/kotori/examples/vendors/weewx.ini /etc/kotori/apps-available/
ln -sr /etc/kotori/apps-available/weewx.ini /etc/kotori/apps-enabled/
systemctl restart kotori
Usage#
Receive measurement data#
mosquitto_sub -h mqtt.example.org -p 1883 -t 'weewx/#' -v
Display measurement data#
Go to https://grafana.example.org/grafana/dashboard/db/weewx-097287c4-6fb0-4aeb-a095-00d65ecb15f7-automatic.
Credits#
Matthew Wall, Tom Keffer and all the other contributors for WeeWX.
Tor Hveem for AmatYr.
Jan Hoffmann for operating a WeeWX installation with a Davis Vantage Pro2 which is delivering interesting data from the shore of Lake Starnberg and for sharing it with us.
Platform usage#
We are not operating an open and collaborative weather information collection platform based on these technologies yet. Stay tuned or go ahead!