luftdaten.info#
Attention
While this endeavor was initially conceived in March 2017, it has spawned a project on its own in the meanwhile. It is called Luftdatenpumpe these days and will assist you in acquiring air quality information from luftdaten.info (LDI) and from the Belgian Interregional Environment Agency (IRCEL - CELINE) (IRCELINE).
The new project is now living at https://github.com/panodata/luftdatenpumpe.
About luftdaten.info#
luftdaten.info is a community project from Stuttgart, Germany. Due to its geographical location, they have high particulate matter (PM) levels on a regular basis.
People around the OK Lab Stuttgart, a project supported by code for germany of the open knowledge foundation constructed cost-effective particulate sensors easily to rebuild by everyone. The sensor readings are acquired by the backend application feinstaub-api, displayed in luftdaten.info map and archived at luftdaten.info Archive.
Luftdaten.info is in the process of installing low cost, crowdfunded sensor nodes across many cities in Germany to measure PM levels.
About Luftdatenpumpe#
Goal#
The goal is to display data from luftdaten.info using a Grafana dashboard for data visualization. Historical data should be able to be displayed by geographical location to make it a meaningful supplement to the luftdaten.info map with more flexible access capabilities compared to the current RRDTOOL-based graphing. luftdaten.info already makes all historical data accessible on the luftdaten.info Archive (CSV format) and live data via luftdaten.info API (JSON format).
There are two different data paths:
[x] Read data from live json api and republish to MQTT, see MQTT.
[o] Import historical CSV data, see CSV data acquisition.
Description#
The main workhorse, luftdatenpumpe requests data from the live API of luftdaten.info each 10 minutes, enriches it with geographic location information (reverse geocoding) and republishes its results to the MQTT bus. Kotori picks it up from there, stores it into InfluxDB with appropriate tags as pivot points and adds a corresponding Grafana dashboard for data visualization.
As one of the authors of the feinstaub-api outlined here:
You can easily implement a “proxy” that translates json to mqtt. Then you can use this proxy as a custom api.Historical data can be found here: https://archive.luftdaten.info/Graphs can be found here: https://www.madavi.de/sensor/graph.phpLive data can be found here: https://api.luftdaten.info/static/v1/data.jsonThis file is updated every minute and contains all sensors and values sent to the server in the last 5 minutes.
luftdatenpumpe is such a translator and can be used as an universal MQTT forwarder.
Demo#
Live Data#
List of stations#
Screenshots and live data#
Live data#
Screenshots#
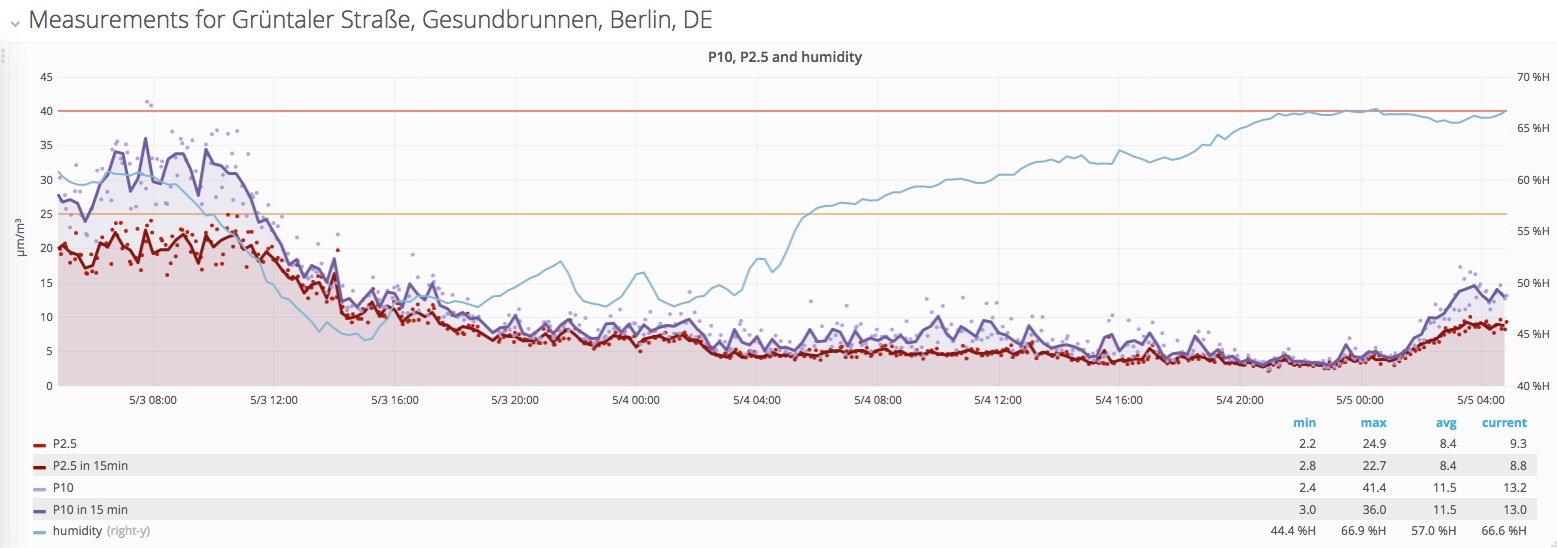
luftdaten.info - Measurement timeseries by location, with EU-Limits as threshold lines#
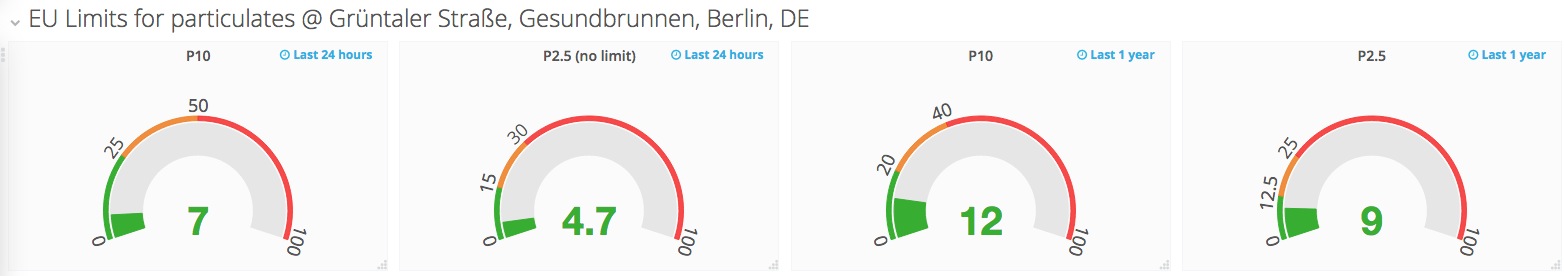
luftdaten.info - Current measurement value, with EU-Limits (green)#
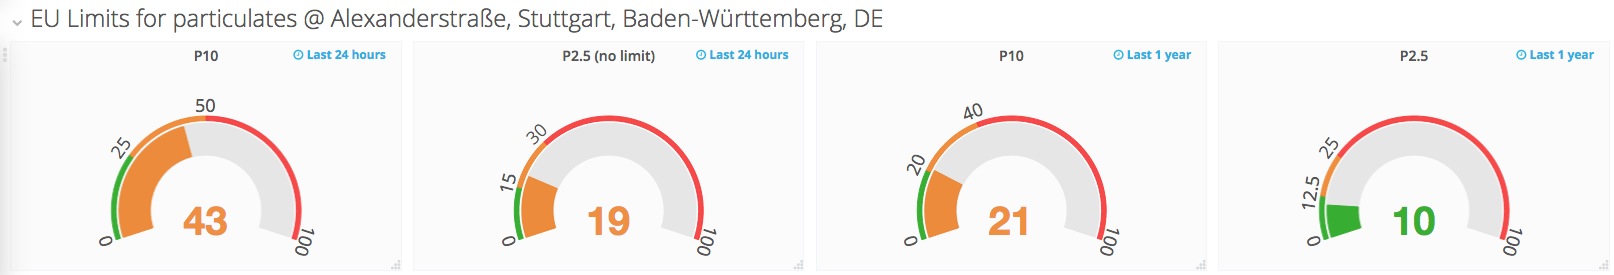
luftdaten.info - Current measurement value, with EU-Limits (orange)#
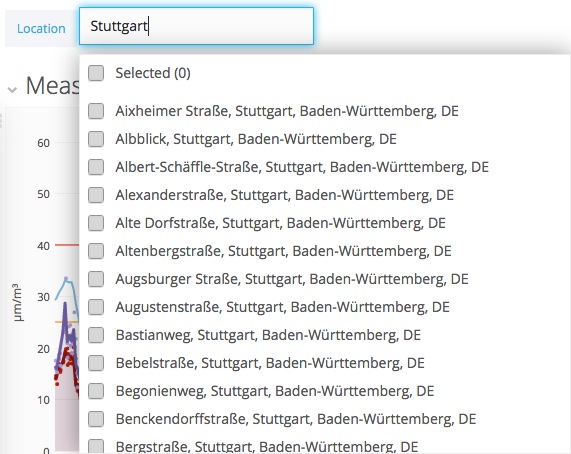
luftdaten.info - Location chooser#
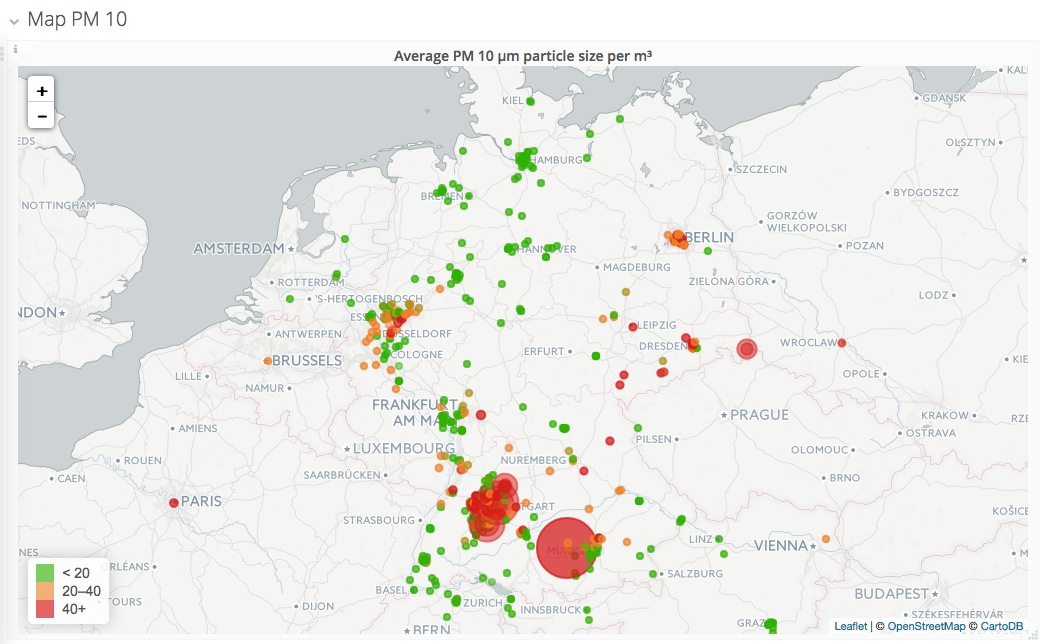
luftdaten.info - Grafana Worldmap#
Setup#
This section is about running the whole platform on your own hardware. For full installation of the InfluxDB/Grafana/Mosquitto/Kotori stack, please have a look at the Setup page.
InfluxDB#
Configure /etc/influxdb/influxdb.conf:
[[udp]]
  # High-traffic UDP
  enabled = true
  bind-address = ":4445" # the bind address
  database = "luftdaten_testdrive" # Name of the database that will be written to
  batch-size = 5000 # will flush if this many points get buffered
  batch-timeout = "30s" # will flush at least this often even if the batch-size is not reached
  batch-pending = 100 # number of batches that may be pending in memory
  read-buffer = 8388608 # (8*1024*1024) UDP read buffer size
Then:
systemctl restart influxdb
Kotori#
Activate luftdaten.ini as configuration:
ln -sr /etc/kotori/examples/vendors/luftdaten.ini /etc/kotori/apps-available/
ln -sr /etc/kotori/apps-available/luftdaten.ini /etc/kotori/apps-enabled/
systemctl restart kotori
Luftdatenpumpe#
luftdatenpumpe requests data from the live API of luftdaten.info, enriches it with geospatial information and republishes it to the MQTT bus.
Synopsis#
/opt/kotori/bin/luftdatenpumpe --mqtt-uri mqtt://mqtt.example.org/luftdaten/testdrive/earth/42/data.json --geohash --reverse-geocode --progress
2017-04-22 03:55:50,426 [kotori.vendor.luftdaten.luftdatenpumpe] INFO   : Publishing data to MQTT URI mqtt://mqtt.example.org/luftdaten/testdrive/earth/42/data.json
2017-04-22 03:55:51,396 [kotori.vendor.luftdaten.luftdatenpumpe] INFO   : Timestamp of first record: 2017-04-22T01:50:02Z
100%|..........................................................................| 6782/6782 [01:01<00:00, 109.77it/s]
Run each 10 minutes#
/etc/cron.d/luftdatenpumpe:
# /etc/cron.d/luftdatenpumpe -- forward data from luftdaten.info json api to mqtt

# run luftdatenpumpe each 10 minutes
*/10 * * * * root /opt/kotori/bin/luftdatenpumpe --mqtt-uri mqtt://mqtt.example.org/luftdaten/testdrive/earth/42/data.json --geohash --reverse-geocode --progress
Usage#
This is an ad hoc example about how to republish measurement data.
Subscribe to the luftdaten.info feed on MQTT:
mosquitto_sub -h mqtt.example.org -t 'luftdaten/#' -v
Start feeding measurements:
luftdatenpumpe --mqtt-uri mqtt://mqtt.example.org/luftdaten/testdrive/earth/42/data.json --geohash --reverse-geocode --progress
Data payloads will be per-sensor in JSON format, enriched by geographic location information.
Example MQTT messages:
luftdaten/testdrive/earth/42/data.json {"sensor_id": 2115, "sensor_type": "SDS011", "P1": 11.17, "P2": 7.95,               "time": "2017-05-05T01:27:42Z", "location_id": 1064, "geohash": "u33dbz90yu6r", "location_name": "Gr\u00fcntaler Stra\u00dfe, Gesundbrunnen, Berlin, DE"}
luftdaten/testdrive/earth/42/data.json {"sensor_id": 2116, "sensor_type": "DHT22",  "temperature": 12.3, "humidity": 65.5, "time": "2017-05-05T01:27:42Z", "location_id": 1064, "geohash": "u33dbz90yu6r", "location_name": "Gr\u00fcntaler Stra\u00dfe, Gesundbrunnen, Berlin, DE"}
Credits#
All the people of luftdaten.info.
Richard Pobering for thoughtful design decisions, hard work on the beautiful Grafana dashboards and for pushing things forward in general.
Agenda#
Todo
Import historical data from the luftdaten.info Archive.
All acquisition infrastructure for reading the CSV format is in place already, but there is still some data munging required. To get results of similar richness as the live data import, some parts of the code should be refactored from the luftdatenpumpe program to the internal data acquisition routines to provide things like reverse geocoding also when importing raw CSV files.
Todo
There are more things on the todo list.